
Table of contents
Czytasz teraz:
Analytics In Marketing: Why Is It Needed And How To Build it
Close
Analytics is an important part of marketing. Without it, it’s impossible to understand whether you are successfully moving forward and what to do next. The Ringostat platform team will describe what analytics in marketing consists of and what tools to use at different stages of company development.
What is marketing analytics?
Marketing analytics is the process of measuring the effect of launched activities and developing a plan to strengthen them. With its help, you can understand how marketing affects the success of the company, as well as find out the number of sales from advertising, brand awareness, etc.
We can say that the global goal of marketing analytics is to attract maximum leads and sales, having the optimal amount of budget. To find the most effective promotion channels and invest in them, and disable or optimize the rest. In a word, to make sure that the funds for promotion bring the maximum benefit. Also, a marketing analyst should be able to predict what effect certain activities will lead to.
The Importance of Analytics in Marketing
Without marketing analytics, a company risks spending years on channels and tools that do not work. Or use images that do not attract customers, but, on the contrary, cause rejection.
(You will find the rest of the article below the form)
Contact us and get a free quote
We will analyze your business and prepare an individual price offer for the optimal marketing mix for you. Completely free.
Verseo spółka z ograniczoną odpowiedzialnością with its registered office in Poznań, at the following address ul. Węglowa 1/3, 62-122 Poznań is an administrator of your personal data.
About Verseo
Company’s office is located in Poznań. Company is entered into the register of entrepreneurs, kept by the District Court of Poznań – Nowe Miasto i Wilda in Poznań, 8th Commercial Division of the National Court Division under number 0000596164, NIP (Tax Identification Number): 7773257986. You can contact us by writing a letter on the address indicated above or e-mail:[email protected]
You have right to:
- access to your personal data,
- correct your personal data,
- demand to remove your personal data,
- restrain to process your personal data,
- object of process your personal data,
- transfer your personal data,
- withdraw consent.
If you think we process your personal data not in accordance with the law, you have right to object to supervisory authority – President of Personal Data Protection Office.
We process your personal data to:
- handle your question, based on art. 6 ust. 1 lit. 6 of General Data Protection Regulation
- promote our goods and services including ourselves in connection with your consent, based on art. 6 ust. 1 lit. a of General Data Protection Regulation
- protect or claim in connection with our reasonable interest, based on art. 6 ust. 1 lit. f General Data Protection Regulation
You share your personal data freely. Please remember that without sharing your personal data you will not be able to send us a message, and we will not be able to answer you.
We can share your personal data with trusted recipient:
- providers of tools made for: website analytics, marketing automation,
- hosting operators.
We will process your personal data by the time:
- which is necessary to achieve a specific purpose for which they were collected and after this term by the time which is necessary to protect or possible claim,
- of withdraw your permission .
We don’t process personal data in a way, which would involve making only automated decisions about you. More information about processing of personal data you can find in our privacy policy.
For example, some Ringostat clients in the past have allocated their marketing budget simply equally among the channels. However, by already connected call analytics and going deeper there, they realized that part of the money was regularly used for inefficient activities.
Here are some statistics that show the importance of analytics for marketing and business in general.
- 76% of marketers make decisions based on data analysis.
- 32% of marketers quoted marketing analytics and competitive insights to be the most important factors in supporting their marketing strategies.
- 69% of marketers say it’s preferable for a company to have a marketing analytics team.
- Marketing analytics is the most significant investment for marketers, adding 16% to their annual budgets.
Stages and tasks of forming marketing analytics
First, let’s look at the tasks that marketing analytics solves.
- Development of measurable and understandable indicators that will evaluate the success of the marketing strategy.
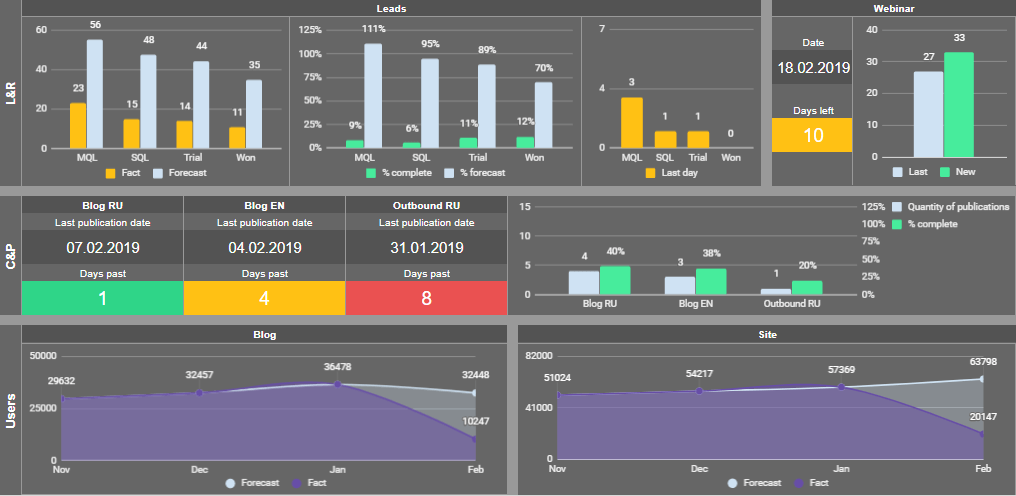
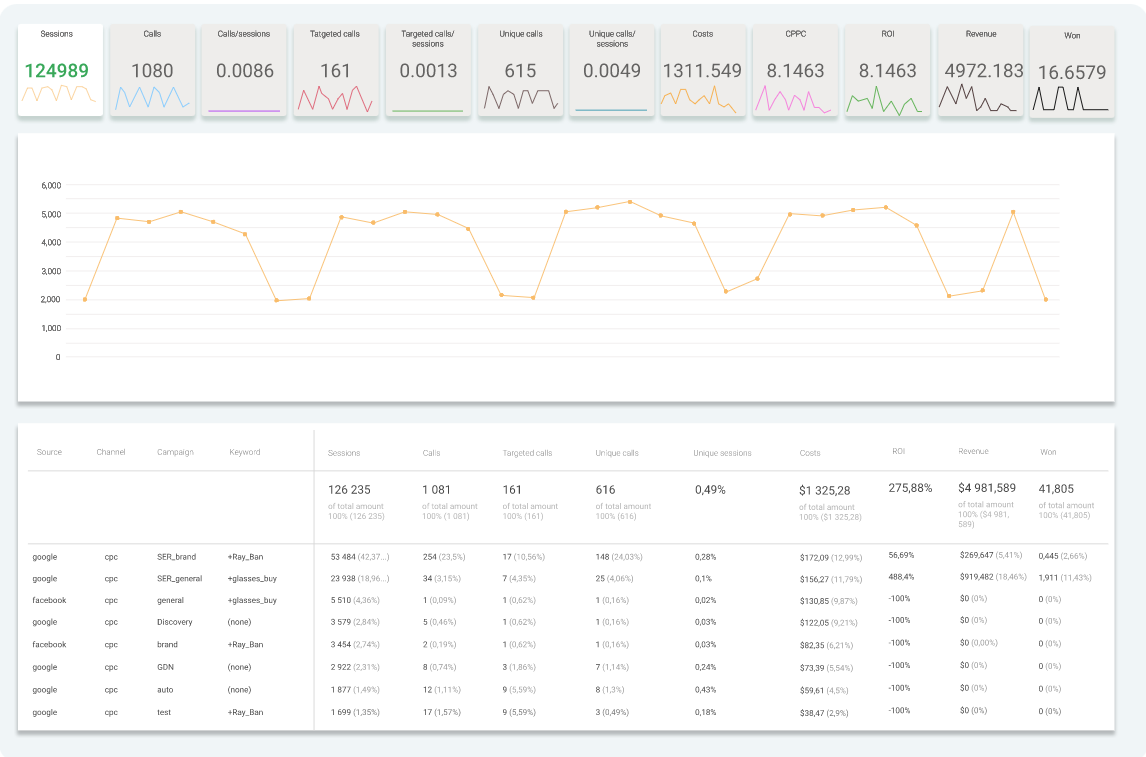
- Getting data about user behavior and conversions. For example, you can get data from web analytics systems, event-based analytics, call tracking, etc. Here is an example of a dashboard that contains the main indicators and KPIs of the marketing department.
- Evaluation of the effectiveness of all online and offline promotion channels.
- Monitoring the company’s role in the market, researching competitors and the activities they launch.
- Compilation of analysis, forecasts, and reports to assess the qualitative and quantitative indicators of success. We will take a closer look below at the difference between reports and analysis.
- Search for growth areas and potential risks for business. For example, a marketer monitors how a competitor is developing. And if another market player systematically misses some activities, then it makes sense to use this opportunity.
- Development of promotion recommendations based on historical data and forecasts.
Now let’s list the stages of work that a marketer or analyst goes through in order to solve the tasks. Everything here depends on the scale and ambitions of the business. But in general, they come down to the steps described below.
- Formation of KPI and development of relationships between them. For example, it can be ROI and ROMI, the number of leads, targeted calls, the amount of the average check, etc.
- Statement and decomposition of the task, the purpose of which is to change KPI. Let’s say a company has a task to enter the Bulgarian market. One of its subtasks is preparing articles for Bulgarian readers. And it includes smaller subtasks for adapting publications.
- Connecting and configuring sources from which you can get data for analytics. For example, the number of leads can be taken from CRM. The marketer receives conversion data from Google Analytics.
- Collection and aggregation of data. For example, setting up their automatic transfer to a special dashboard, visualization.
- Summarizing. Analysis, calculation of how indicators have changed.
- Development of recommendations. A marketer or analyst describes the steps that are required for the growth of indicators. At the same time, the specialist must calculate in detail that action A will lead to changes in KPI by N%. And the implementation of changes will cost N% of the budget.
- Implementation of changes for KPI growth. For example, drawing up a plan for the year for orders or leads, the growth of the average check size. And again, the decomposition of global tasks into smaller ones.
- Retrospective — that is, an in-depth analysis of data for past periods. We will describe it in detail below.
It is clear that you cannot compare marketing analytics of a micro-business and an e-commerce giant. But we will analyze how it generally differs in companies of various sizes. And what to consider for different types of businesses that are promoted through digital channels.
Small and micro business
In such companies, the role of an analyst is usually performed by a marketer, or even by the owner/head of the business. But this does not mean that you can work without marketing analytics at all. If you make decisions based only on intuition, then the business is risking not to grow.


The main task for small and micro businesses is to clearly understand what activities are effective and scale them up.
Although the budgets here are low and the connection of special tools will be unprofitable, there are also free ones. And there are enough useful tips and digital guides on the web, which describe must-have services and approaches.
What to consider
- If you are promoting online, learn the basic concepts of digital marketing. You must understand what ROI, CPC, CTR, and other key indicators are.
- Check your Google Analytics reports regularly. They give you enough information at this stage. So you can evaluate the effectiveness of your site and running ads in ready-made reports:
- Learn how to work with Google Sheets. Their capabilities are enough to build an analytical tool for a small company. Also, learn how to drive information from other sources into a spreadsheet and visualize it.
- Classify leads. If you do not have a CRM, then write down all clients in a table with notes. For example, “Consultation”, “Spam”, “Wrong number”. This will help you determine if quality traffic is coming from marketing activities.

Medium business
These companies already have a marketer. If a business also has a sales analyst, then it’s easier. It will help to evaluate how the sales of concrete products are related to their promotion. For medium-sized businesses, budgets allow connecting more serious tools to help the analyst.
But often managers of medium-sized businesses make mistakes:
- believe that analytics should be done by a marketer — in addition to his main duties;
- if there is an analyst in a crew, then they give too many different tasks to him: analysis of competitors, sales, procurement planning, and pricing;
- they ignore the point that analysis should be carried out regularly and data should be observed in dynamics.
It turns out that the owner wants to get a full-fledged analytical department represented by one specialist. Meanwhile, he won’t be able to spend a lot of time on analysis, by simultaneously performing other important tasks. Therefore, the best option is the decomposition of responsibilities between specialists. They also need to be equipped with tools that will allow them to analyze the return on marketing in depth.
What to consider
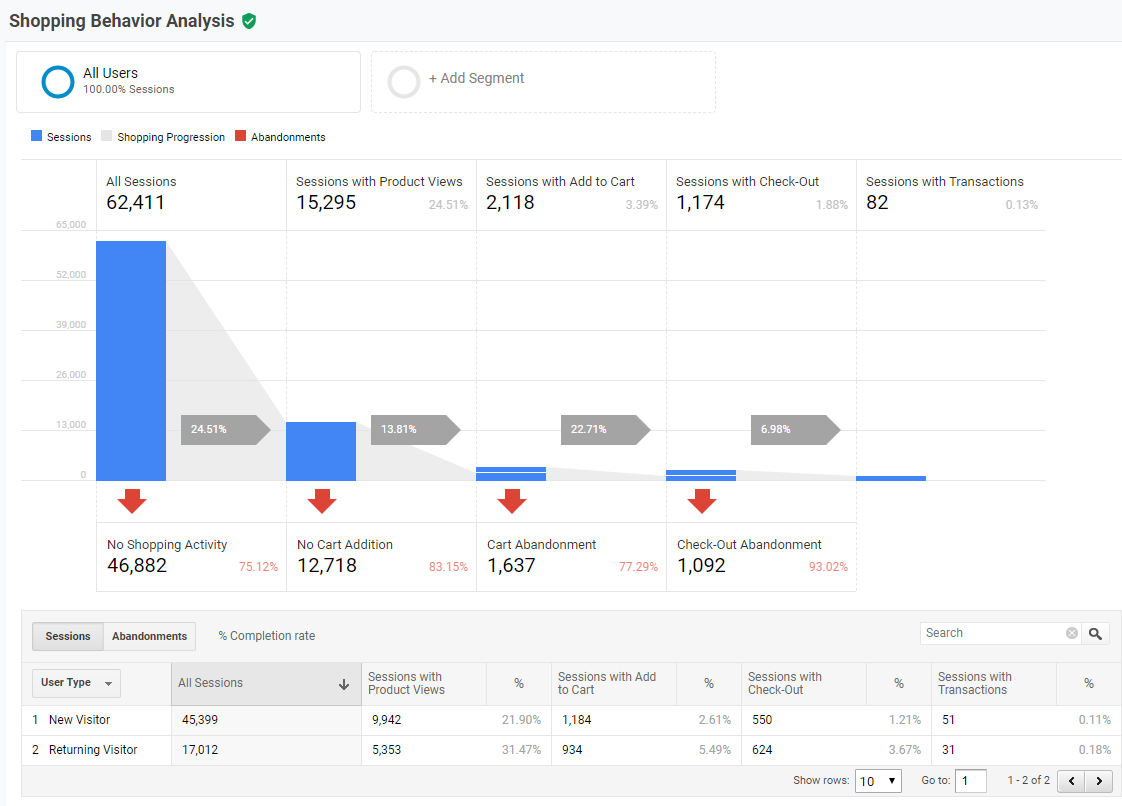
- Set up the e-commerce module in Google Analytics. This way you will see all transactions, the average check, the most popular products, and much more.
- If at least some of the customers contact your company by phone, install call tracking. Otherwise, you will not be able to analyze how incoming traffic is converted into calls and requests. Here is an example call log with sources:
- Connect CRM if you haven’t set it up yet. And don’t forget to integrate it with telephony and call analytics. In this case, the sources of transactions will be automatically transferred to the system.
- Set up end-to-end analytics. This is a tool that automatically calculates the return on investment in marketing. The easiest way to do so is to purchase a ready-made tool. In this case, you do not have to involve a programmer. Such a system drives income from a CRM, and promotion costs from advertising accounts. The analyst receives a ready-made report with key indicators.
- Even if the promotion is made by an outsourced agency, the analyst cannot just stand aside. You need to constantly interact with the contractor in order to achieve high results.

Big business
Companies with impressive turnover, most often, have big data. Analysts have a huge responsibility here. Therefore, it is especially important that the information be systematized and clearly visualized.
Often, large businesses engage an outsourced analyst who is involved in building complex dashboards and interpreting data. And the CMO is already working closely with him in conjunction, so he makes a final decision.
What to consider
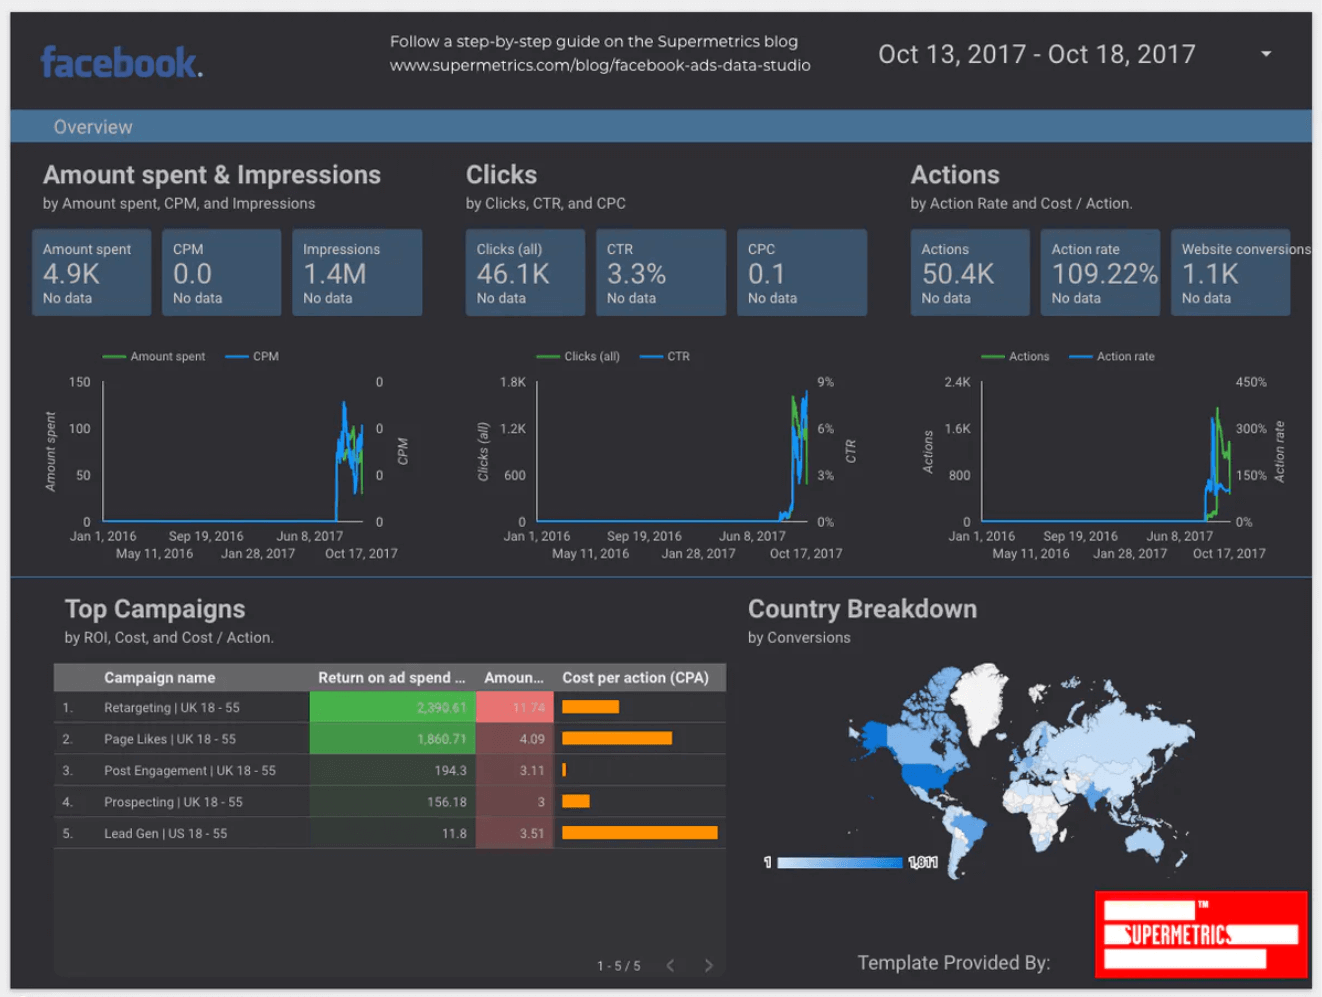
- Google Sheets will not drive a large amount of data, such a document will take too long to load. Therefore, use special tools for visualization and reporting. For example, Microsoft Power BI.
- Large companies often use many services and need them to share data. Connector services, for example, Zapier, will help to establish this process.
- Connect event-based analytics services. For example, Woopra or Kissmetrics. Such systems will help analyze the behavior of the client on different devices, synchronizing data from different sources. And automatically update customer profiles in real-time.
- Some big businesses rely on display or offline advertising, in addition to digital channels. There is a misconception that they just work for the brand and their effectiveness in terms of money. And leads there are not so easy to track. This is not true. For example, call tracking will allow you to track calls from advertising on TV and radio. If you need to accurately evaluate the return on display advertising, contact an agency with the appropriate expertise.
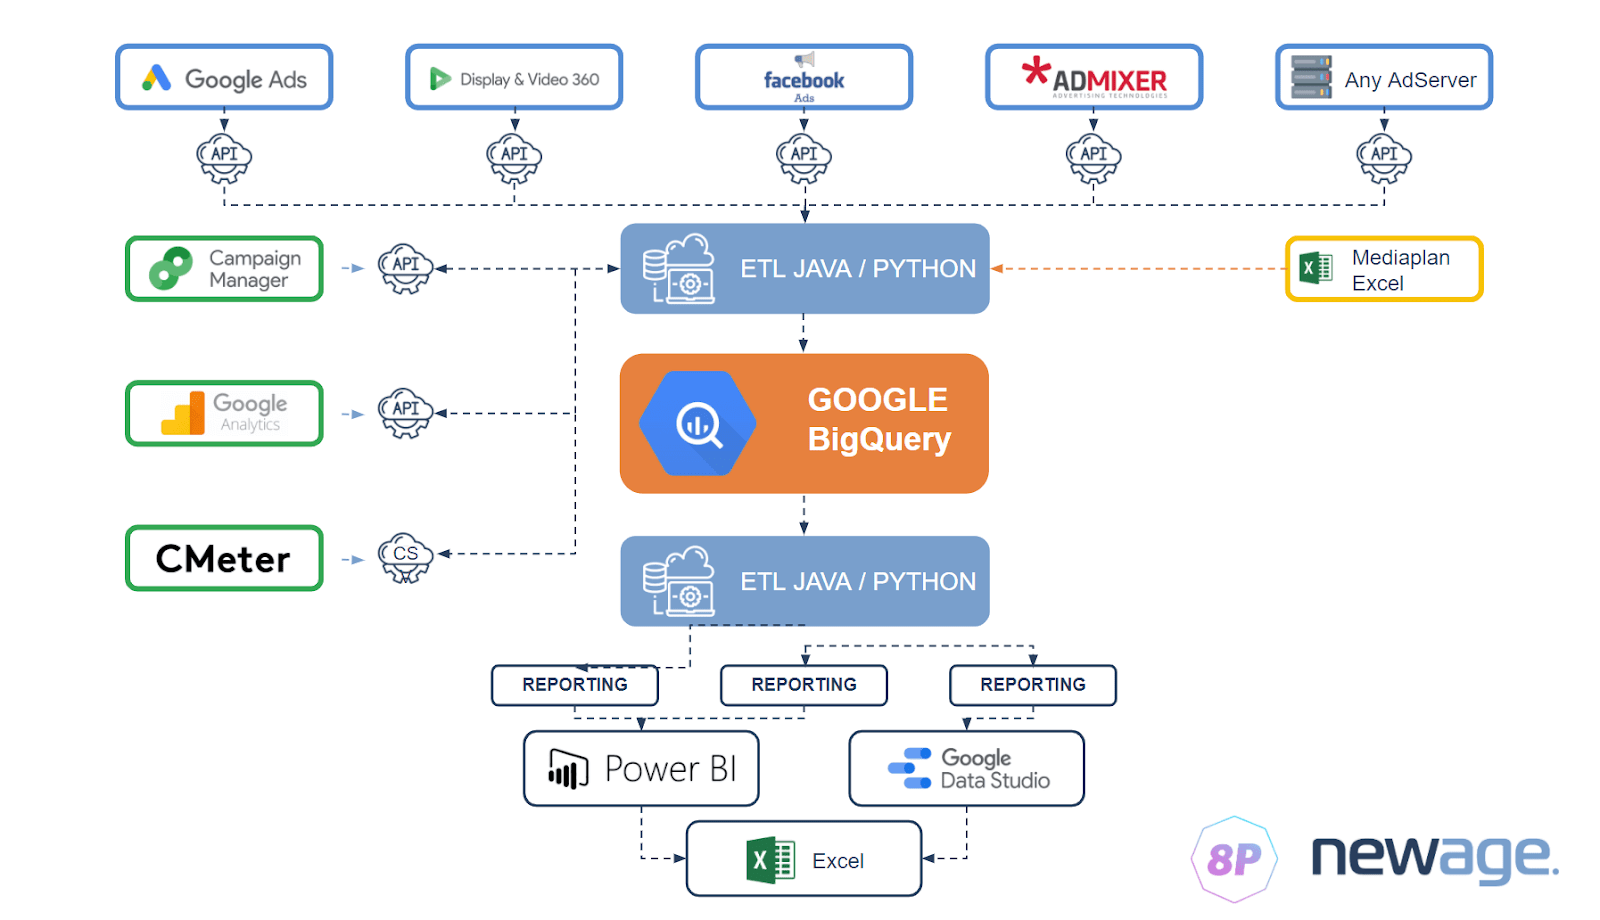
In this scheme, one of the agencies combines data to evaluate the effectiveness of display advertising for their clients
Differences between reports and well-built analytics
Reports and analytics are not the same thing. Rather, the first ones are the components of the second one. If you are a manager or a business owner, and the analyst only provides you with reports, then he does only part of the work. Let’s look at the difference.
A report is a standardized document with a selection of data for periods and/or indicators that are requested. For example, there may be a report on the number of leads from the context for May. This sample includes only data for the past period. And it can be generated automatically, for example, in Google Data Studio.
Analysis is a comprehensive look at the desired metric. It includes not just a selection of data for past periods, but also an explanation of why this happened, and recommendations for the future. It is difficult to automate it, because it can refer to the task that needs to be solved. For example, to analyze why the number of organic calls decreased and what to do next. The analysis may also contain a forecast.
Retrospective
Retrospective analytics is just one of the duties of a profile specialist. This is precisely the compilation of reports at the request of management. For example, once a month or a week such reports are provided by the agency to the customer. In a retrospective, a specialist compares the expected data with the fact one, possibly, how the tests worked out, etc.


Ideally, an in-house analyst should take the initiative and find the data himself to discover valuable insights. For example, regularly listening to calls from customers. Look for weaknesses in the sales funnel, identify trends and much more.
An example of built analytics for an online store
Let’s take a quick look at how analytics for an online store can be built. It all depends on the scale, but we will analyze useful reports and indicators that the analyst pays attention to.
Web analytics system
Like any other business, an online store must analyze the effectiveness of promotion using Google Analytics. The most useful reports for this are:
- Traffic sources — All traffic — Source channel: here you can see what activities bring you real users;
- Campaign Report: shows how many leads you got from paid ads;
- Keyword Report: shows which keywords drive traffic, but it’s important to pay attention to its quality;
- E-commerce module: shows key metrics specifically for e-commerce: transactions, revenue, the number of additions to the cart for each product, etc.;
- Conversions: shows how often people achieve key goals: for example, whether they download content or fill out online applications, etc.;
- Audiences: allows understanding what demographic characteristics have your website visitors ;
- User behavior: a report that provides a complete picture of the actions on the site.
Call tracking
People might want to call online stores. Therefore, in e-commerce, with customized analytics, you cannot live without call tracking. After connecting such a service, you can collect data on the ad that has driven to the client’s request.
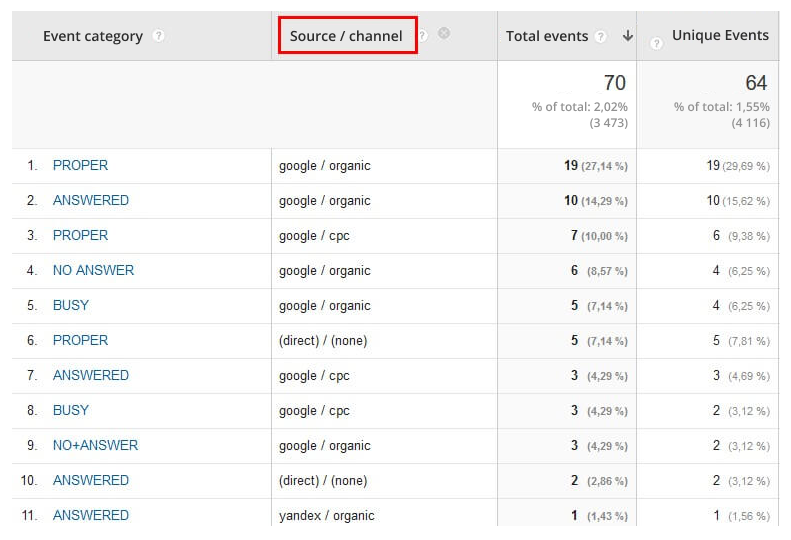
An analyst can daily log in the personal account of a call tracking service and see how many calls were from different sources. Below is an example of a report showing the source, channel, campaign, and even the keyword:
It is important for analysts to pay attention to such reports:
- missed calls — to understand how many deals are lost because of the sales department;
- separately for calls from paid ads and organic search;
- statistics on calls from the callback widget, if the service provides it.
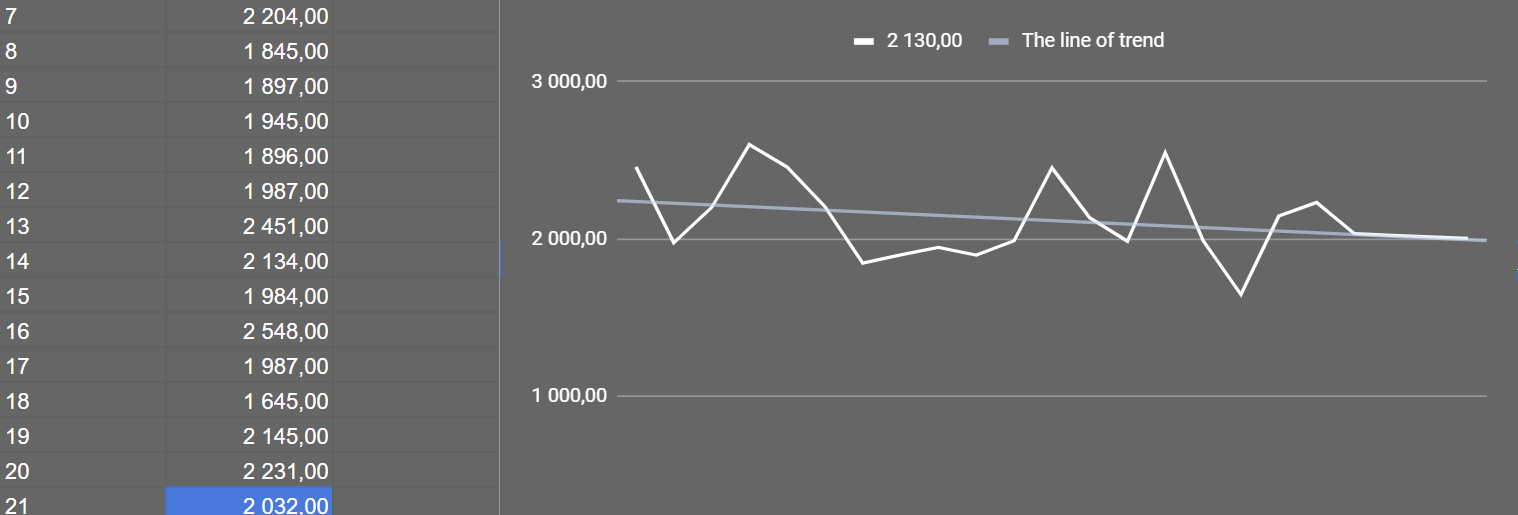
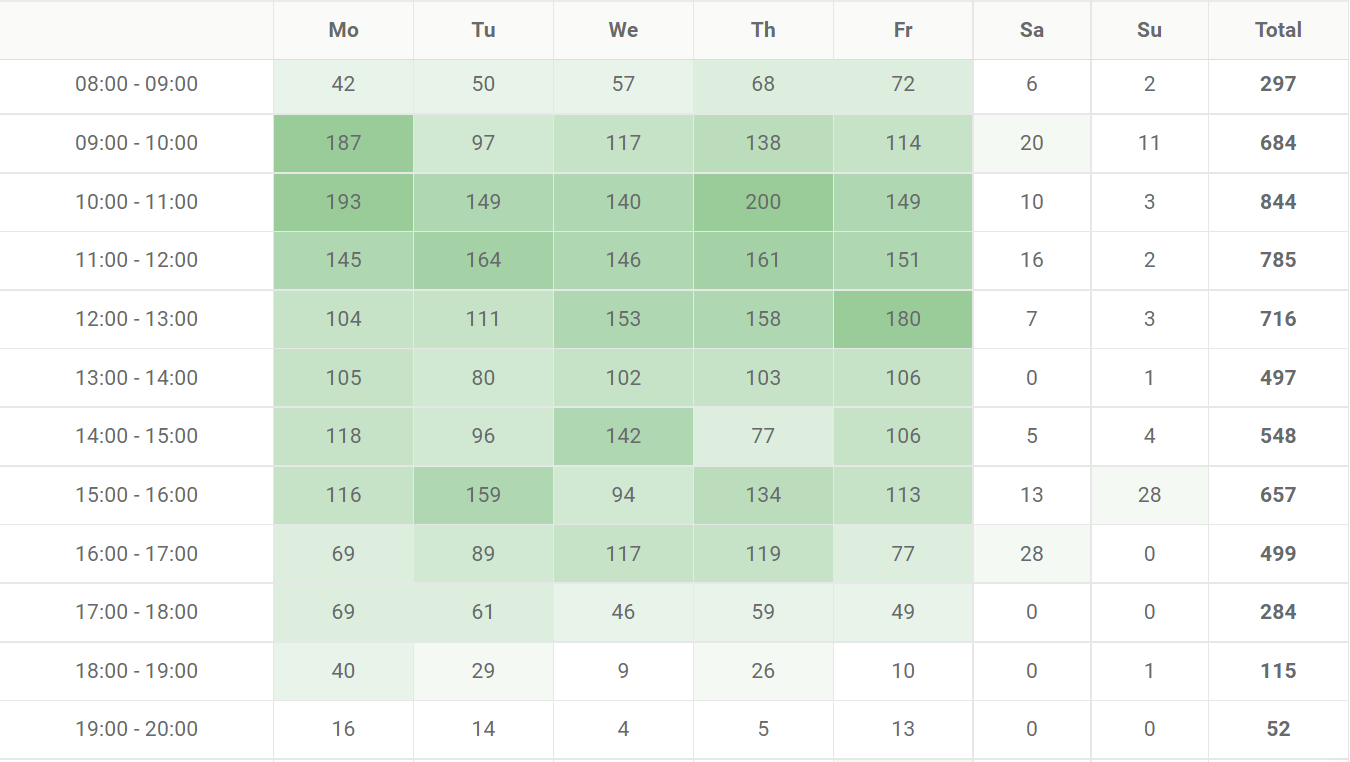
The analyst also pays attention to the peak hours and days that drive the most calls. This data will influence the bid management at this time and even the development of an optimal schedule for the sales department:
Usually, call tracking is integrated with Google Analytics. After that, call data is automatically transferred to the web analytics system. Thus, the effectiveness of ads can be evaluated both by online conversions and by calls. Here is an example of a report in Google Analytics with calls of different statuses:
CRM
This system not only helps the sales department. It can also provide lots of valuable information to analysts. If you integrate it with analytical services, then it will receive data on sources that brought each lead. For example, the user who made a call.
Based on this data, the analyst can evaluate how investments in ads pay off through sales. But it is quite difficult to do it manually for all channels, so end-to-end analytics can be enabled for this purpose.
End-to-end analytics
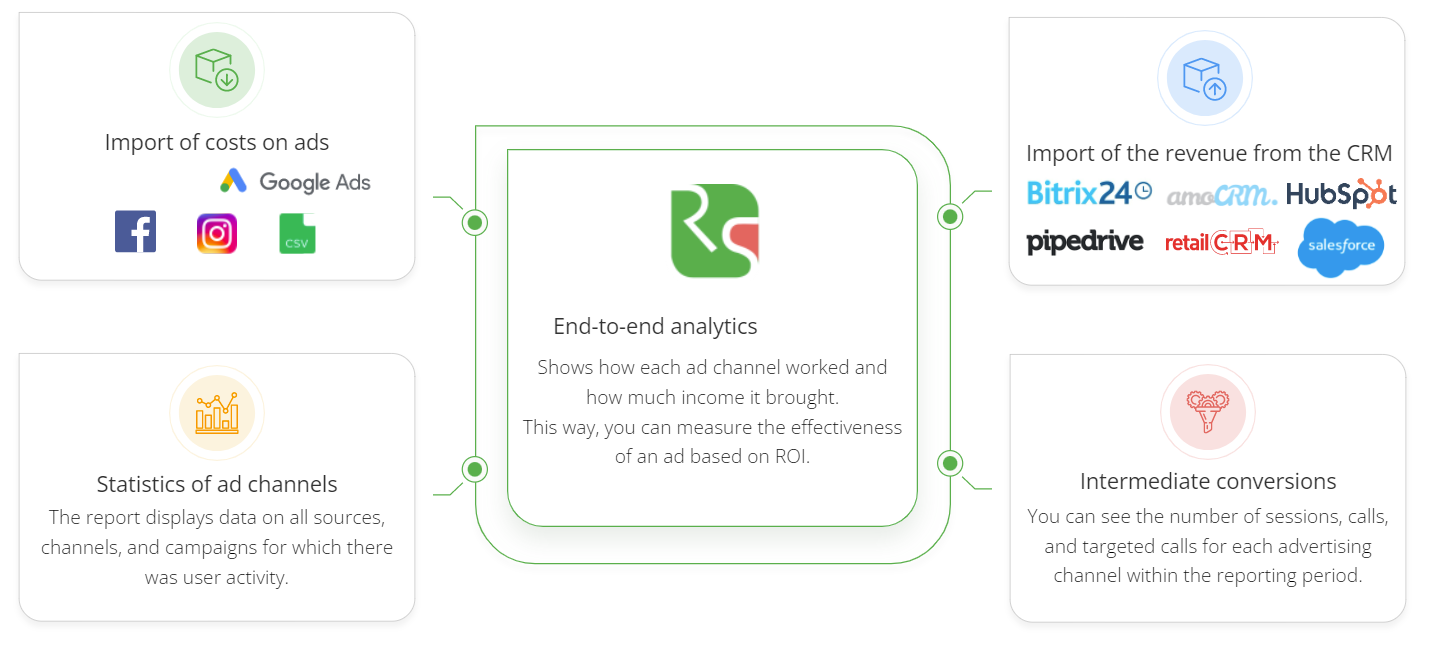
When an online store has all of the systems described above configured, it can set up end-to-end analytics.. Thus, this service will be able to link the costs per paid ads with income from it and calculate ROI.
As a result, the configured analytics scheme may look like this:
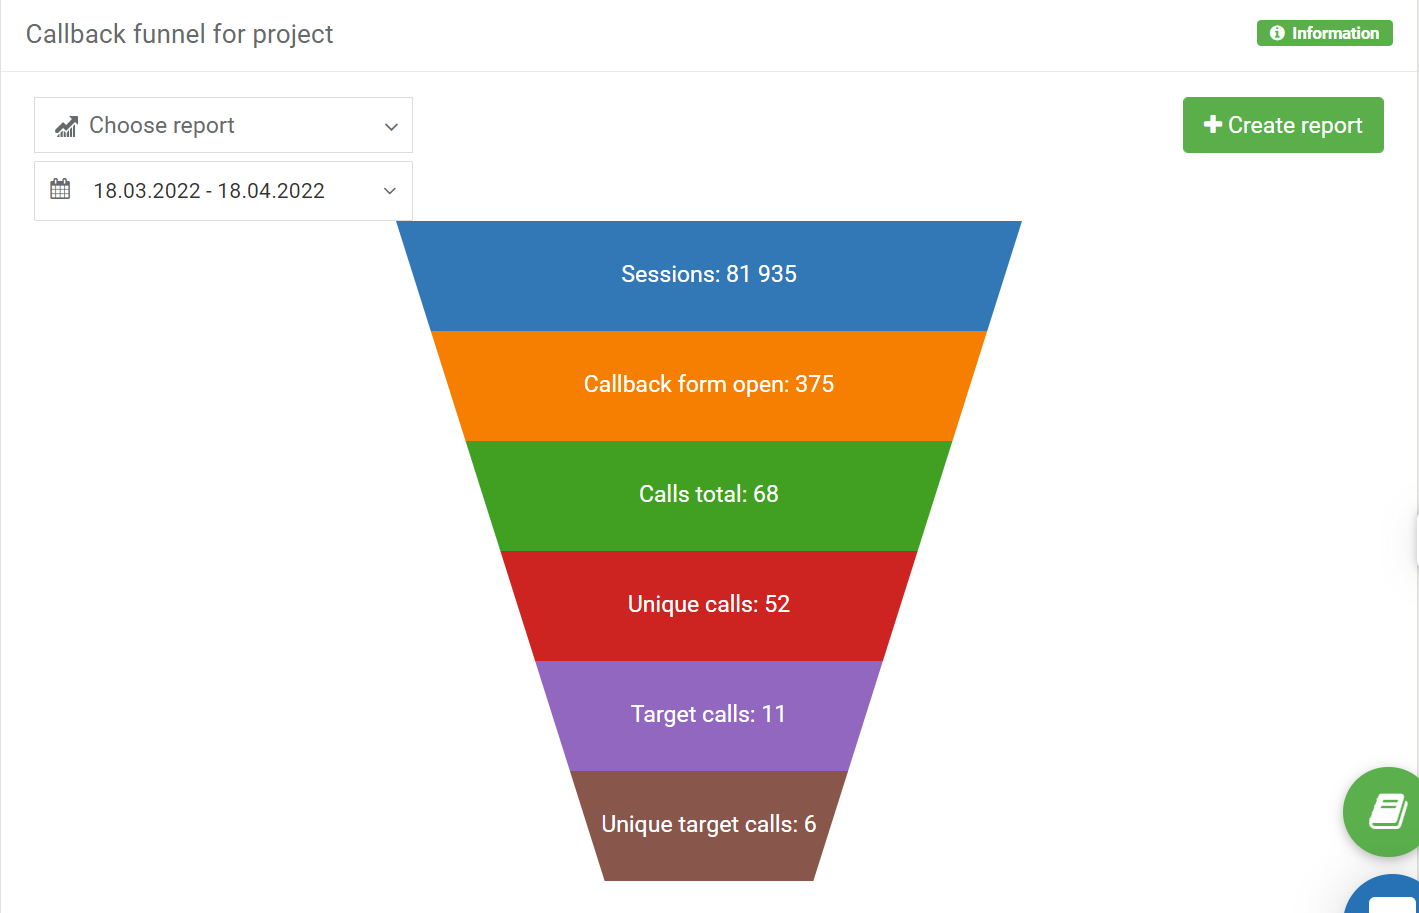
Its result is a report showing the number of calls, deals, revenue for each channel:
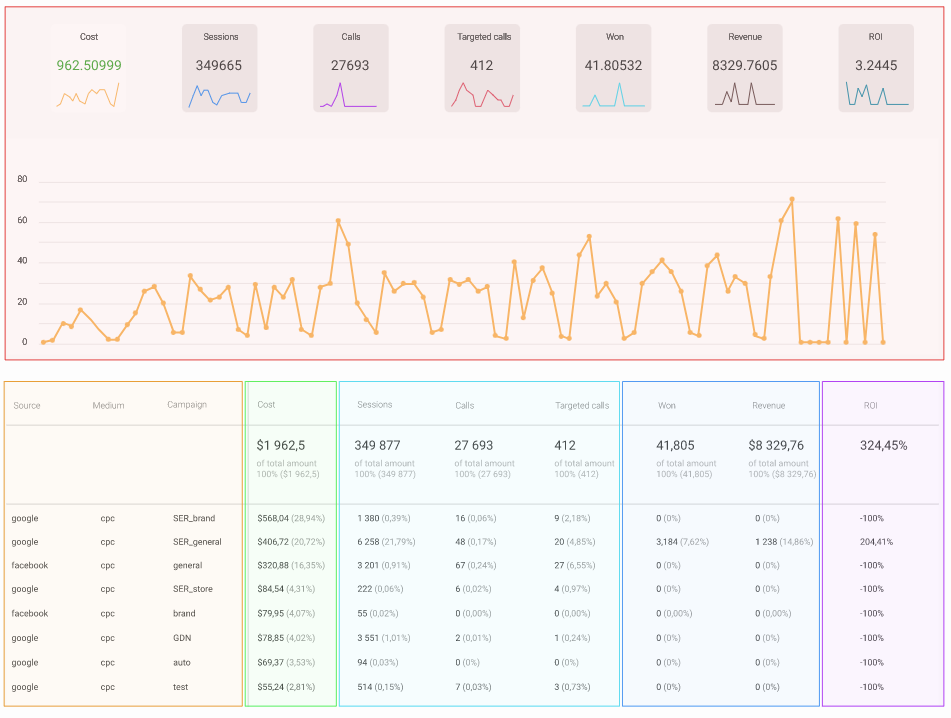
Such a report links different levels of data. From the very top of the funnel — the number of sessions from different sources, to performance metrics which are expressed in money and ROI.


To sum up
- Marketing analytics is the process of measuring the effect of launched activities and developing a plan to strengthen them. With its help, you can understand how marketing affects the success of the company, the number of sales, brand awareness, etc.
- Without marketing analytics, a company risks investing in tools that don’t work. Or use ads that don’t attract customers, but, on the contrary, cause rejection.
- To build analytics: learn the basic concepts of digital marketing, define your goals, and regularly check the reports of web analytics systems. Learn how to work with Google Sheets and/or other data collection and visualization tools.
- An online store should install the e-commerce module in Google Analytics. It is important to connect call tracking if customers call the store. Set up a CRM and end-to-end analytics, so you can understand how investments in ads pay off.
- Reports and analytics are not equal. The first one can be called the component of a second one. If you are a manager or a business owner, and the analyst only provides you with reports, then he does only part of the work.